- Model or Input validation in ASP.Net Core
- Basics of ASP.Net Core
- Caching in ASP.Net Core
- Rate Limiting in API
- Nunit Test for Model Validation
- Serilog in Web API to Store Logs
- Web API Crud using Stored Procedures
- Auto Mapper in ASP.Net Core
- Crud on Bulk Data
- Import Data Excel to DB
- Export Data in Excel
- ViewBag in MVC Core
- ViewData in MVC Core
- Service Lifetime in MVC Core
- LINQ Queries
- JWT Token in ASP Core
- ViewModel in MVC
- Custom MiddileWare
- Global Exception Handling using Custom Middileware
- Exception Filter
- Dropdownlist in ASP Core
- Authentication in MVC
- MVC Crud with ADO
- Paging in MVC
- Casecading Dropdown
- First React Project
- Hooks in React
- React Crud with API Core
- Save Image in DB
- MVC Core Charts
- State Management
- Session in ASP Core
- Design Patterns
- Singleton Pattern
- Dependency Injection
- Keyed Services Dependency Injection
- Repository Pattern
- Factory Pattern
Charts in ASP.NET Core MVC
Problem Defination :- We have a requirement in which we need to present Sales data of a company in different charts. So we have implemented Charts with Chart.JS a javascript library and fetch the Sales data from a table in database.You can better understand our requirement with below images.
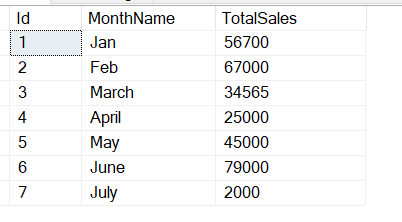
Above image represents the table data into the database.It has three columns ID,MonthName and TotalSales of the respective Month.
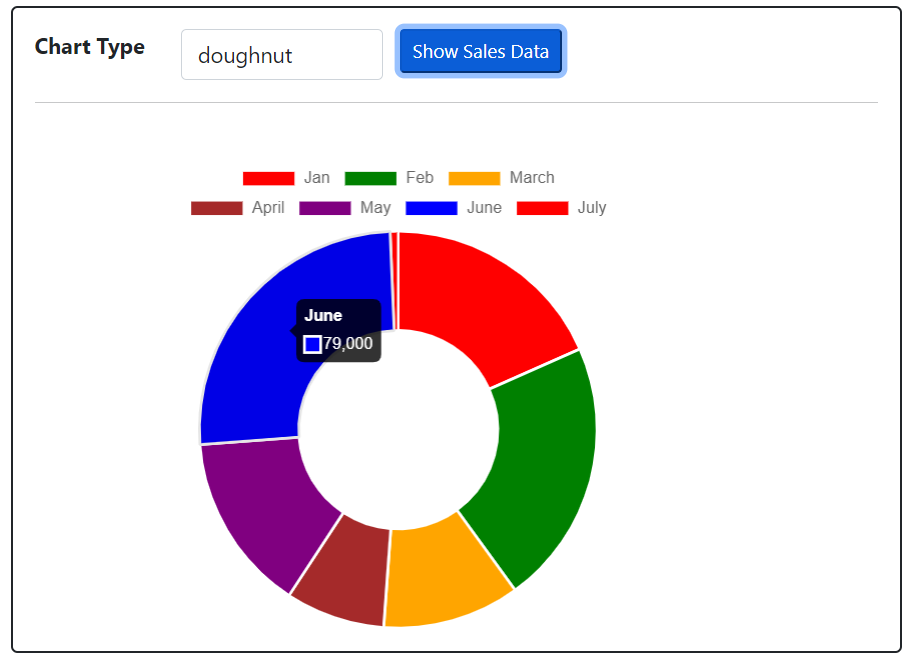
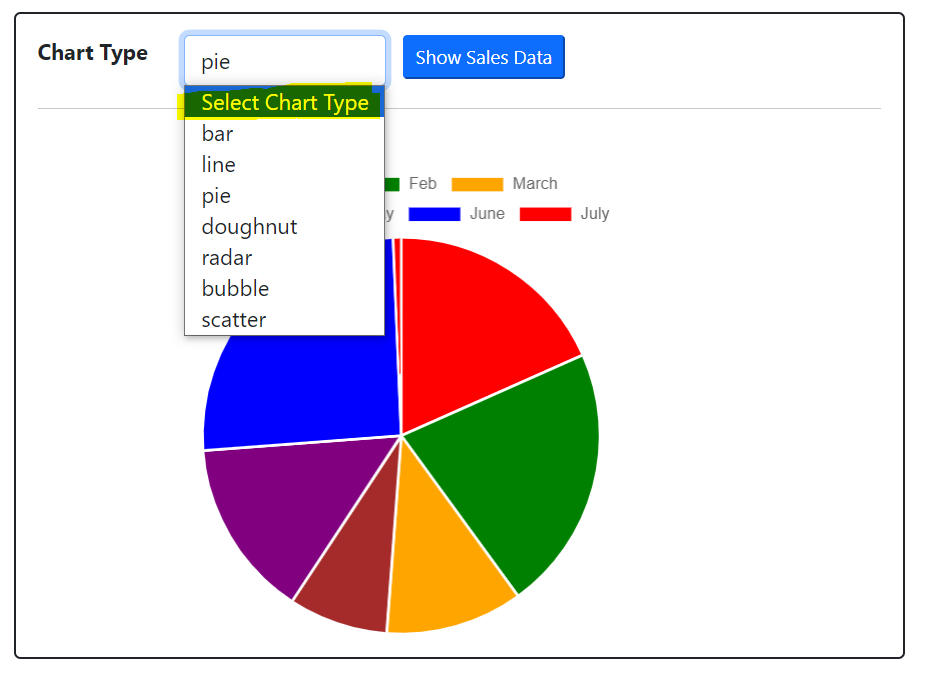
Above image is the chart representation of the sales data in doughnut chart,you can change the chart type as shown in below image.
Implementation :- To implement charts functionality firstly we have to follow below steps
- Create a Model Class for Sales Data.
- Create a Controller named it Sales.
- Add these Sales model class into the DbContext class and then execute the migration commands.
- Create a Action Method named it ShowSalesData() for view the charts.
- Create a method named GetSalesdata() for getting the sales data from database.
- Create a view for ShowSalesData() action method
- Add a reference for Charts.Js file from the chartjs official website.
In The implemetation phase we will create one model class which is used for Sales Data.
Below is the code for Sales Model class.
 public class Sales
    {
        [Key]
        public int Id { get; set; }
        public string MonthName { get; set; }
        public int TotalSales { get; set; }
    }
Now create a DBContext class and named it as demoDBcontext and add the public DbSet
Now Create the Controller with named Sales and write the below Action Methods into it.
ShowSalesData() is the method in which we are showing chart.
  public IActionResult ShowSalesData()
        {
            return View();
        }
        [HttpPost]
        public List<'object> GetSalesdata()
        {
            List<'object''> result = new List<'object''>();
            List labels = _db.Salestable.Select(p => p.MonthName).ToList();
            result.Add(labels);
            List salesNumber = _db.Salestable.Select(p => p.TotalSales).ToList();
            result.Add(salesNumber);

            return result;
        }
ShowSalesData View :- Design the view for presenting the chart and we create a button for show sales data when we click on this button charts will be appear in canvas.
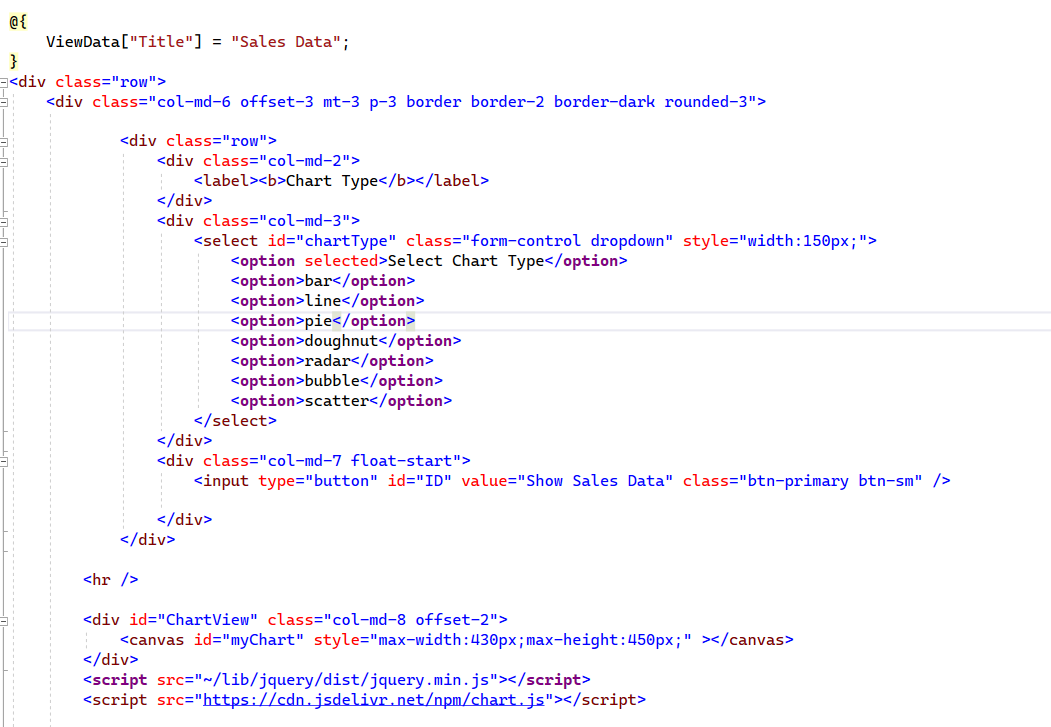
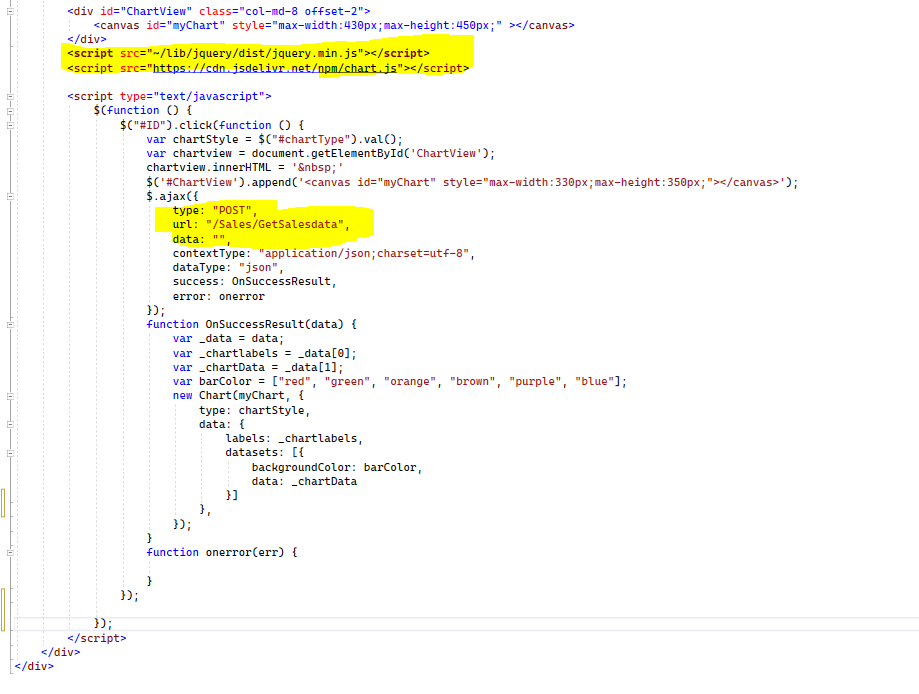
For showing the data into the charts we have used a canvas and a dropdown list for chart type based on the selection of the chart type we present the data into the canvas using the Ajax call for controller and action method. Complete code for Javascript is shown in below image.